Know your building's
exact number
before we meet.
Three inputs. Real figures. The math that separates buildings that hold value from those that quietly erode it.
Your Property Parameters
Reserve Fund Health
Industry benchmark: 70% funded
Cost Per Unit
$0per unit / month
Efficiency Score
0/100Industry avg: 65
Projected Annual Savings
$0Estimates based on industry benchmarks for luxury residential management. Actual results vary. Full audit provided upon engagement.
Twelve towers.
Zero surprises.
Hover any property to see the operational data behind the facade.
47
Properties
6,200+
Total Units
98.8%
Avg Occupancy
21 min
Avg Response
$4.2B
Portfolio Value
4.9/5
Satisfaction
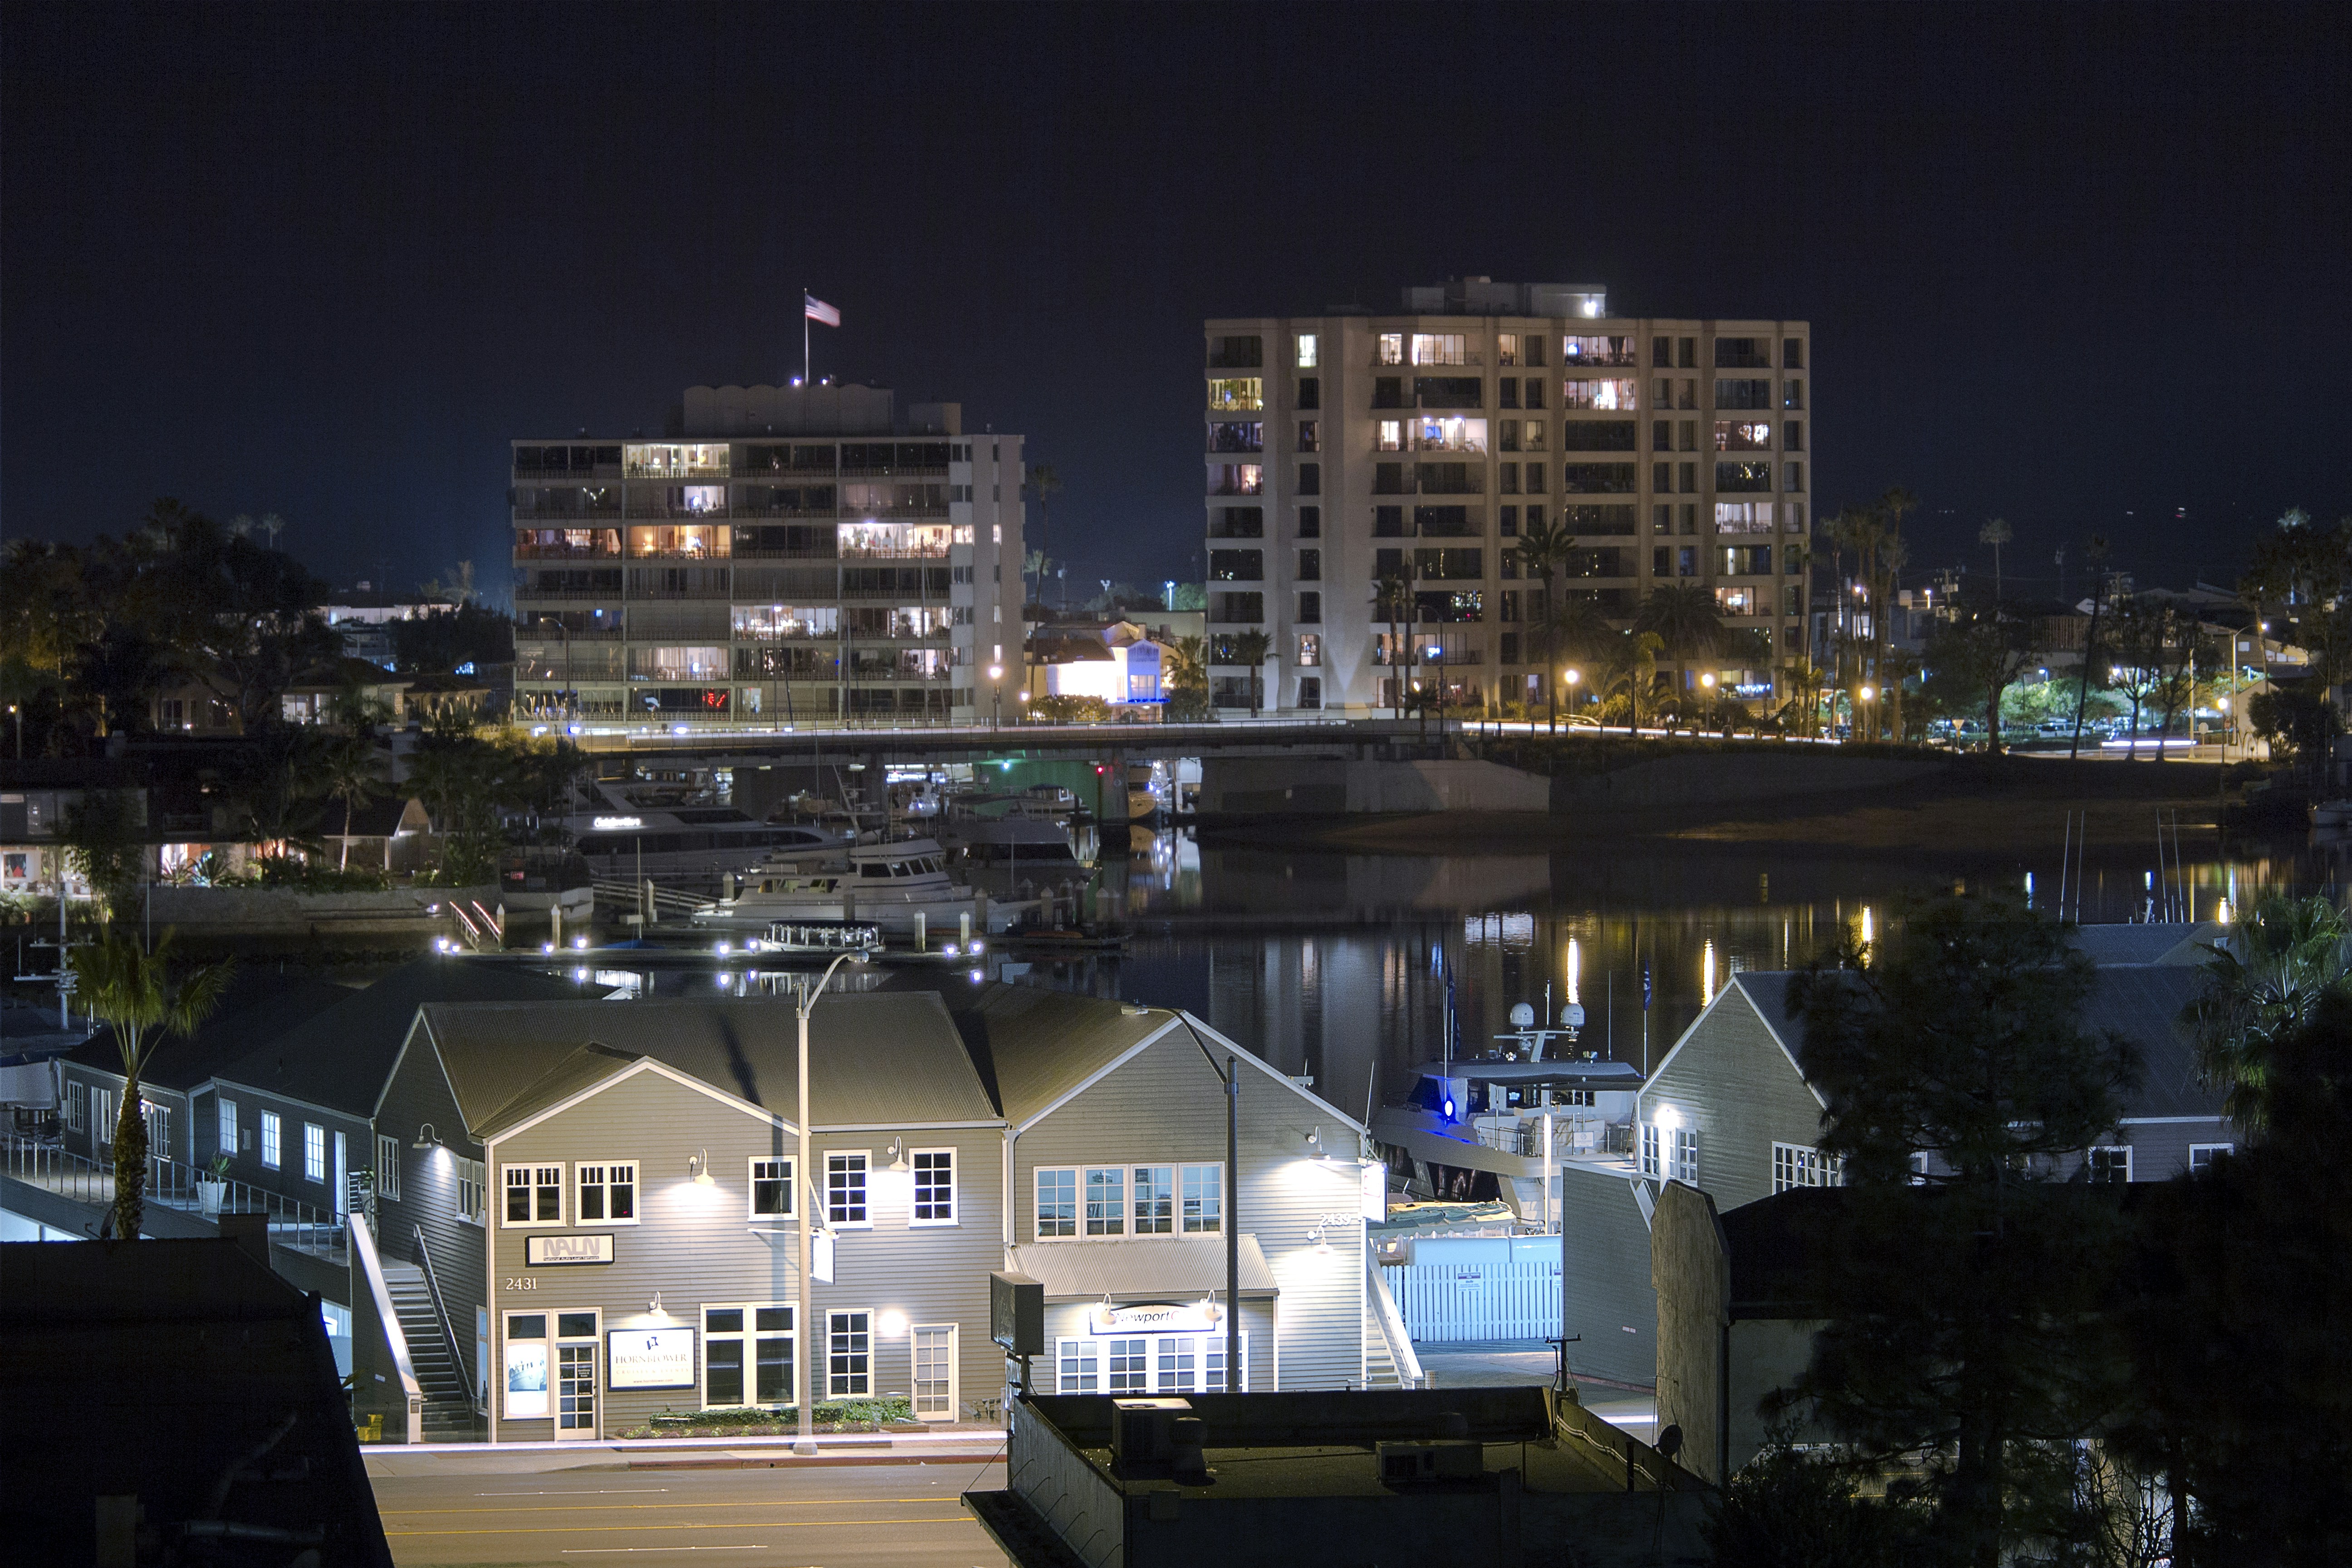
Miami Beach, FL
Meridian Residences
248 units · $847M
Miami Beach, FL
Meridian Residences
Occupancy Rate
98.4%
Avg Response Time
22 min
Assessment Stability
+1.8% YoY
Resident Satisfaction
4.9 / 5.0

Manhattan, NY
The Beaumont
96 units · $612M
Manhattan, NY
The Beaumont
Occupancy Rate
99.1%
Avg Response Time
18 min
Assessment Stability
+2.1% YoY
Resident Satisfaction
4.8 / 5.0

San Francisco, CA
Harbor Gate Tower
312 units · $1.1B
San Francisco, CA
Harbor Gate Tower
Occupancy Rate
97.8%
Avg Response Time
26 min
Assessment Stability
+1.4% YoY
Resident Satisfaction
4.7 / 5.0

Chicago, IL
Clarendon House
144 units · $388M
Chicago, IL
Clarendon House
Occupancy Rate
98.9%
Avg Response Time
20 min
Assessment Stability
+2.3% YoY
Resident Satisfaction
4.9 / 5.0
Miami, FL
Azure Pinnacle
72 units · $298M
Miami, FL
Azure Pinnacle
Occupancy Rate
100%
Avg Response Time
15 min
Assessment Stability
+1.2% YoY
Resident Satisfaction
5.0 / 5.0

New York, NY
Park & Fifth
188 units · $924M
New York, NY
Park & Fifth
Occupancy Rate
98.7%
Avg Response Time
19 min
Assessment Stability
+2.6% YoY
Resident Satisfaction
4.8 / 5.0
The numbers your current
manager won't show you.
Every figure below is third-party audited. No rounded estimates. No cherry-picked quarters.
Emergency Response
Avg. time to first contact on critical HVAC, flood, and structural events
Industry avg: 87 min
Portfolio Occupancy
Weighted average across all managed residential towers, trailing 12 months
Market avg: 93.2%
Resident Satisfaction
Quarterly survey score across 6,200+ units, independent third-party audited
Competitor avg: 3.6
Assessment Stability YoY
Average annual assessment change — below CPI, protecting unit owner equity
Industry avg: +4.7%
Preventive Maintenance Rate
Work orders completed before failure — not after. Reserve capital preserved.
Industry avg: 71%
Properties Under Management
Active managed communities across seven metropolitan markets
Est. 2008 · 15 years
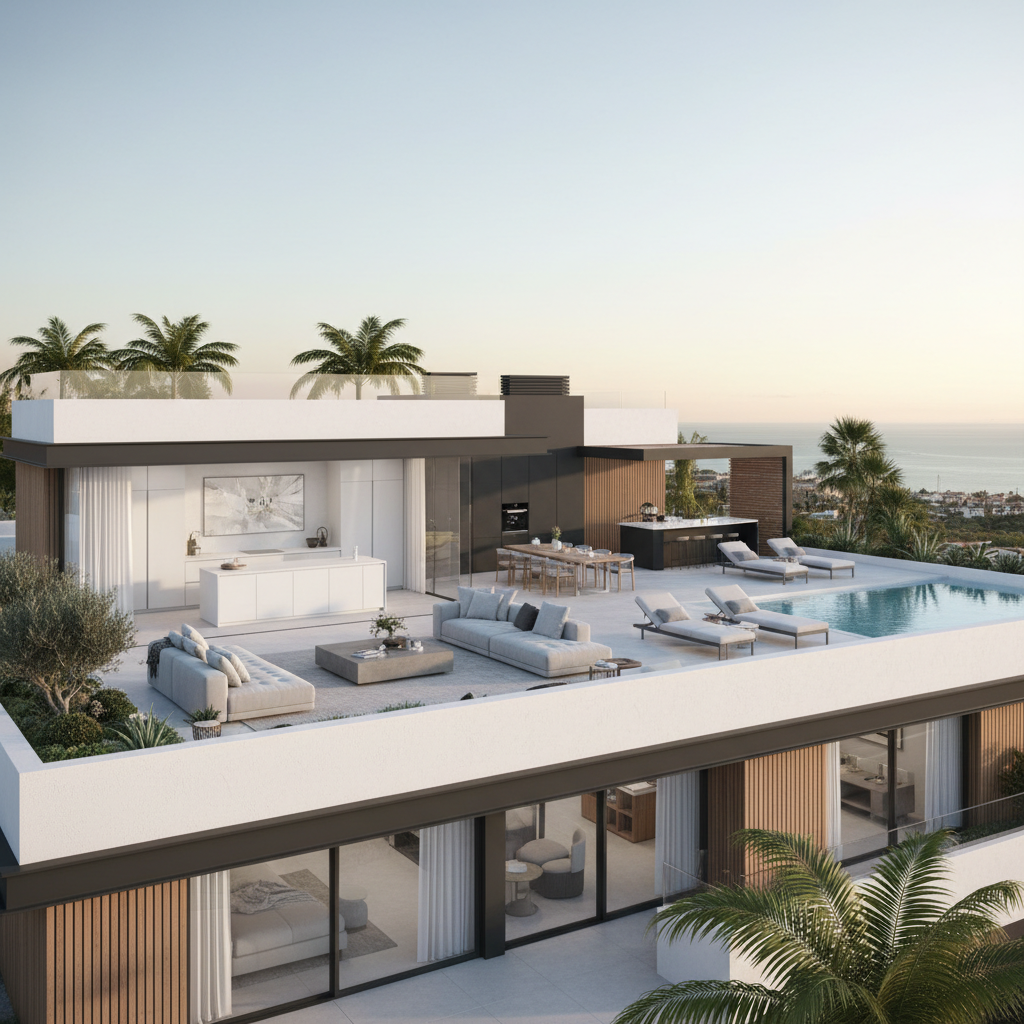
The Harbor Gate Tower
transformation.
312-unit waterfront complex. San Francisco, CA. Self-managed for 6 years before onboarding with Steward in Q1 2023.
Data from Q1 2024 independent audit
$2.4M in documented savings. 12 months.
Net of all Steward management fees. Third-party verified.
The calculator gave you
the number.
Now let us run the full audit — at no cost. A senior partner will review your property's reserve structure, maintenance history, and vendor contracts. You'll receive a 12-page report within 5 business days.
For Board Members
Download Our Board Presentation
A 24-page executive brief covering our management methodology, reserve fund strategy, and case studies — formatted for board review and vote.
$4.2B
Assets Under Management
15 yrs
Operating History
47
Active Properties
100%
Client Retention Rate
"Steward's reserve fund analysis identified $1.8M in deferred liability our previous manager had never flagged. The board voted unanimously to switch within one meeting."
Richard Huang
HOA Board President, Harbor Gate Tower